Data Modeling Foundations
Data Warehouse Fundamentals
OLTP vs. OLAP
- OLTP (Online Transaction Processing)
- Handles real-time transactional data
- Optimized for fast inserts, updates, and reads
-
Examples: Banking, E-commerce systems
-
OLAP (Online Analytical Processing)
- Designed for complex analytical queries
- Aggregates large volumes of historical data
- Supports dashboards, BI, and trend analysis
| Feature | OLTP | OLAP |
|---|---|---|
| Primary Use | Transaction processing | Analytical reporting |
| Operation | CRUD (Create, Read, Update, Delete) | Aggregation, Summaries |
| Data Model | Normalized, relational | Denormalized, dimensional |
| Data Scope | Current operational data | Historical, summarized data |
| Typical Users | Front-line staff, applications | Analysts, decision-makers |
| Query Patterns | Simple, indexed lookups | Complex, multi-table joins |
| Performance Metric | Transaction speed | Query response time |
| Storage Structure | Row-oriented | Column-oriented |
| Data Volume | Small to medium | Very large |
| Update Frequency | Continuous, real-time | Periodic, batch |
Data Warehouse Basics
- Central repository for analytical data
- Integrates multiple OLTP sources
- Support ETL/ELT processes for reporting and BI
Normalization vs. Denormalization
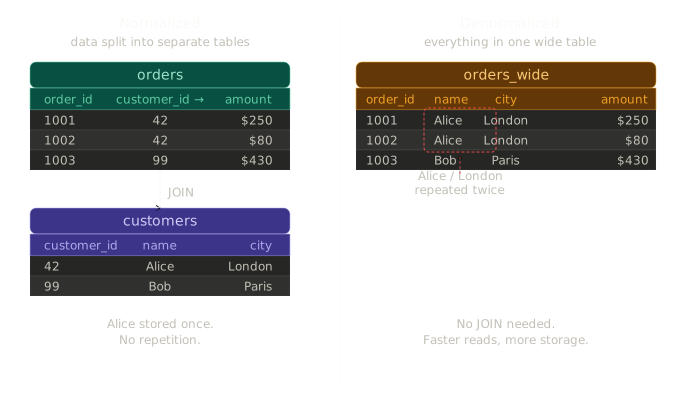
| Aspect | Normalized | Denormalized |
|---|---|---|
| Data repeated? | No -- stored once | Yes -- copied everywhere |
| Risk of inconsistency | Low -- update one place | High -- must update every copy |
| Storage | Smaller | Larger |
| Write speed | Fast (one row to update) | Slow (many rows may need updating) |
| Read / query speed | Slower (needs JOIN) | Faster (everything on one row) |
| Best for | Transactional systems (apps, databases) | Analytical systems (dashboards, reports) |
| Example | PostgreSQL app database | Snowflake data warehouse, dbt mart |
Introduction
- Data structuring affects storage and performance
-
Choosing the right model depends on use case
-
Normalization
- Ideal for OLTP systems
- Organizes data into logical tables
- Reduces redundancy and ensures consistency
-
Denormalization
- Combines tables for faster read performance
- Increases redundancy but improves query speed
- Suited for OLAP and data warehouses
| Aspect | Normalization | Denormalization |
|---|---|---|
| Redundancy | Low | High |
| Query Speed | Slow | Fast |
| Maintenance | Easy | Complex |
| Best for | OLTP | OLAP |
EXPLAIN and ANALYZE command
- EXPLAIN - Show you the query execution plan
- ANALYZE - Execute the query and show you the actual execution plan
EXPLAIN ANALYZE
SELECT
    p.product_name,
    p.category,
    d.date,
    SUM(f.total_price) AS total_sales
FROM fact_sales f
JOIN dim_products p ON f.product_id = p.product_id
JOIN dim_date d ON f.date_id = d.date_id
GROUP BY p.product_name, p.category, d.date;
Core Principles of Data Warehousing
1. Subject-Oriented
A data warehouse is built around major business themes like Sales, Finance, Marketing, Inventory, or Customer behavior.
- Data is grouped by subjects instead of applications
- Makes reporting intuitive and structured
- Helps teams focus analysis around meaningful business areas
2. Integrated
Data from multiple platforms (ERP, CRM, APIs, logs) must be cleaned and standardized before entering the warehouse.
- Consistent naming conventions
- Unified data types
- Standardized date formats
- Resolved duplicates and conflicts
Integration ensures data from different systems can be compared and analyzed reliably.
3. Non-Volatile
Once data is loaded into the warehouse, it is not typically updated or deleted.
- Data remains stable for historical analysis
- Updates happen through new records or batch loads
- Ensures repeatability and trust in analytical results
This stability is what makes trend analysis and forecasting possible.
4. Time-Variant
A data warehouse stores historical data for long-term analysis.
- Every record is time-stamped
- Enables trend reporting, year-over-year comparisons, and forecasting
- Helps businesses understand how patterns evolve
This principle distinguishes data warehouses from transactional databases, which only store current data.
Design and Operational Principles
5. Separation from Operational Systems
Data warehouses should not interfere with day-to-day business operations.
- ETL/ELT pipelines copy data from operational systems
- Analytical queries run on the warehouse, not on production databases
- Prevents performance issues on live systems
6. Use of Dimensional Modeling
Data warehouses commonly use a star or snowflake schema:
- Fact tables hold measurable events (sales, clicks, transactions)
- Dimension tables describe context (product, customer, date, region)
This structure is easy for analysts to understand and optimizes query performance.
7. Consistency and Data Quality
A warehouse must provide data that businesses can trust.
- Deduplication
- Standardized business rules
- Validations during ETL/ELT
- Master data management (MDM)
8. Scalability and Performance Optimization
Warehouses must support growing volumes of data and queries.
- Partitioning large tables
- Indexing and clustering
- Caching frequently used datasets
- Using columnar storage for analytical workloads
9. Metadata and Documentation
Metadata helps users understand what data means and how to use it.
- Business definitions
- Data lineage
- Column descriptions
- Transformation rules
10. Security and Governance
Data warehouses often contain sensitive information, so access must be controlled.
- Role-based permissions
- Row-level and column-level security
- Encryption at rest and in transit
- Audit logging
Basics of Dimensional Modeling
Overview of Dimensional Modeling
- Framework for designing analytical databases
- Organizes data into facts and dimension
- Enhances query performance and clarity
Fact Tables vs. Dimension Tables
| Aspect | Fact Table | Dimension Table |
|---|---|---|
| Purpose | Stores measurable events or metrics | Stores descriptive context for facts |
| Examples | Sales amount, quantity, revenue | Product name, customer city, date |
| Row count | Very large (millions+) | Relatively small (thousands) |
| Changes | Appended over time | Updated when attributes change |
| Keys | Contains foreign keys to dimensions | Contains a primary key |
| Grain | One row per event or transaction | One row per entity |
- Grain
- Define the level of detail stored in a fact atble
- Example: one row per order, per day, per customer
- Must be cleary defined before loading data
Keys and Relationships
- Primary keys: Uniquely identify rows in dimensions
- Foreign keys: Link facts to dimensions
- Ensure referential integrity and consistent joins
Medallion Architecture

- Organizes warehouse data into progressive quality layers
- Each layer refines data closer to business-ready state
- Layers: Bronze, Silver, Gold
Bronze Layer (Raw)
- Ingested source data with no transformation
- Preserves original format for reprocessing
- Append-only and immutable
Silver Layer (Cleaned)
- Deduplicated, validated, and standardized
- Joins and type casting applied
- Conforms to consistent schema
Gold Layer (Business-Ready)
- Aggregated models for specific domains (Sales, Finance, Marketing)
- Optimized for BI dashboards and reporting
- Directly consumed by analysts and stakeholders
Star vs. Snowflake Schema Design
Star Schema
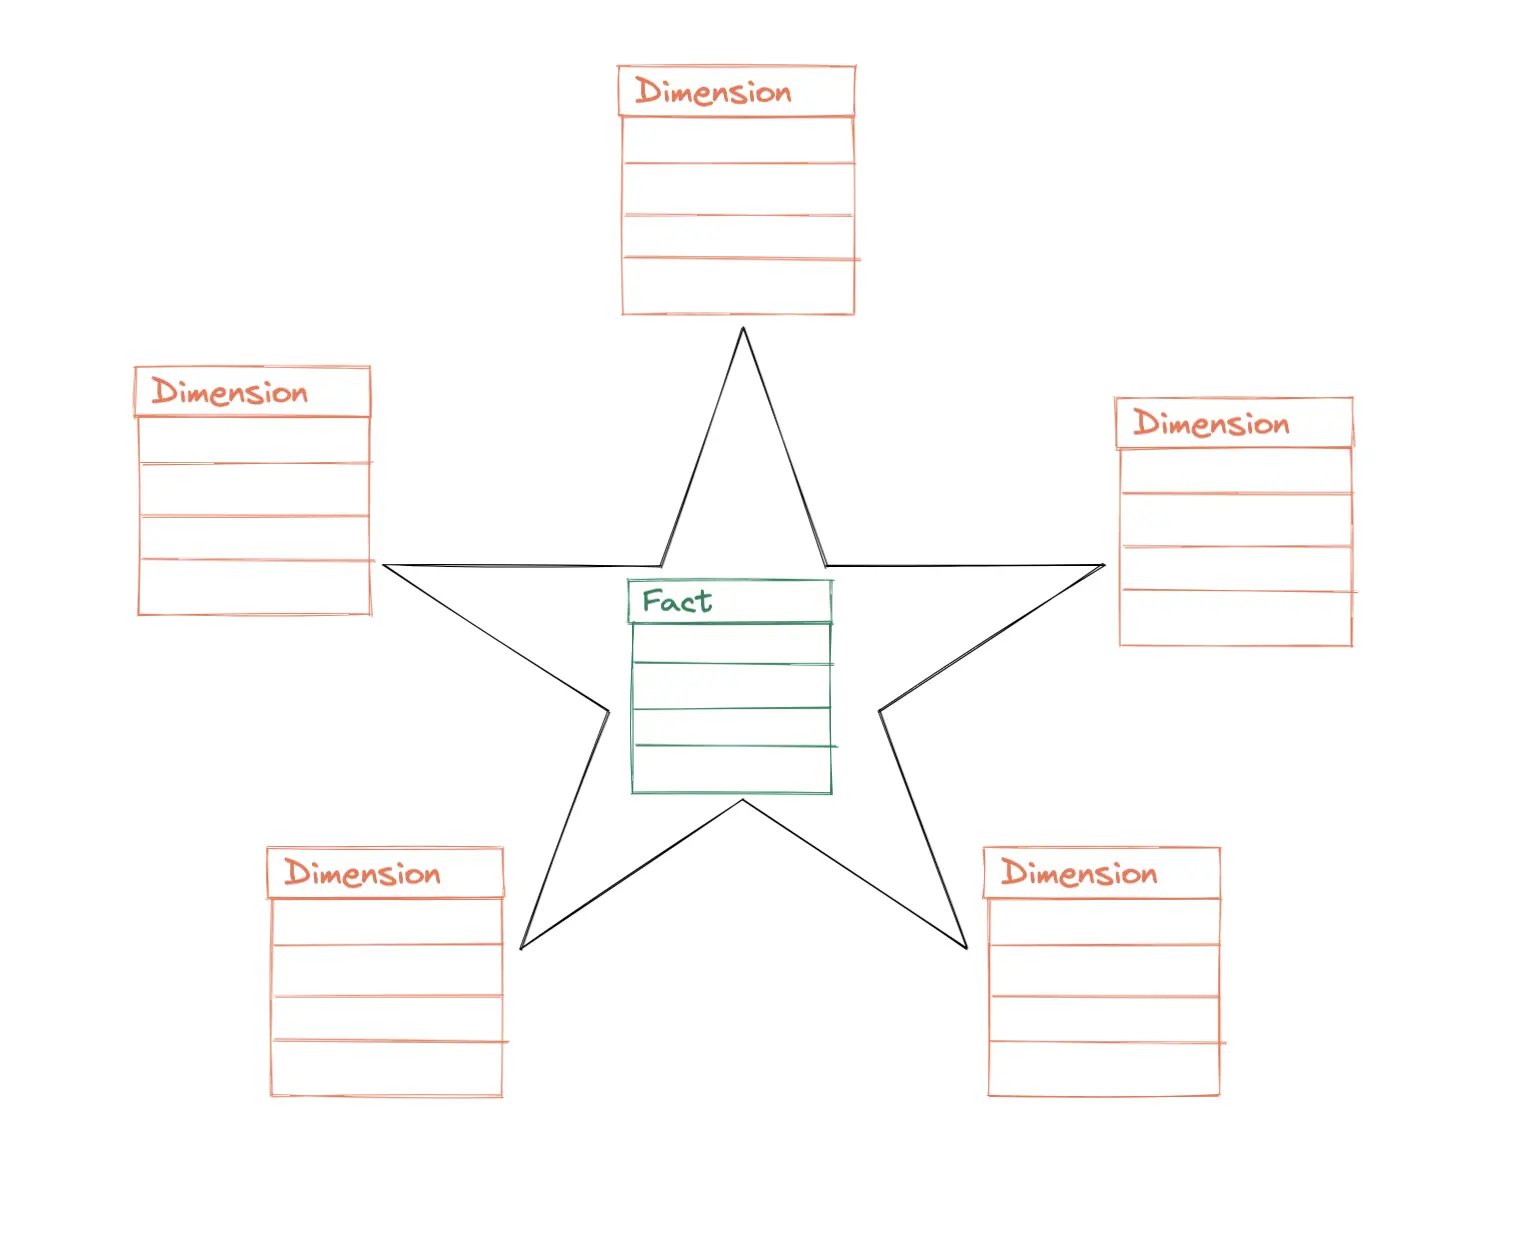
- Central fact table linked directly to dimension tables
- Simple, intuitive, and high-performace design
- Ideal for most BI and reporting systems
-- Star Schema in Postgres (CREATE)
CREATE TABLE dim_customers (
    customer_id INT PRIMARY KEY,
    first_name VARCHAR(50),
    last_name VARCHAR(50),
    email VARCHAR(100),
    city VARCHAR(50),
    state VARCHAR(50),
    country VARCHAR(50)
);

CREATE TABLE dim_products (
    product_id INT PRIMARY KEY,
    product_name VARCHAR(100),
    category VARCHAR(50),
    price DECIMAL(10, 2)
);

CREATE TABLE dim_date (
    date_id INT PRIMARY KEY,
    date DATE,
    year INT,
    month INT,
    day INT,
    quarter INT,
    week INT,
    day_of_week VARCHAR(10)
);

CREATE TABLE fact_sales (
    sale_id INT PRIMARY KEY,
    customer_id INT REFERENCES dim_customers(customer_id),
    product_id INT REFERENCES dim_products(product_id),
    date_id INT REFERENCES dim_date(date_id),
    quantity INT,
    unit_price DECIMAL(10, 2),
    total_price DECIMAL(10, 2)
);
-- Joining star schema
SELECT
    p.product_name,
    p.category,
    d.date,
    SUM(f.total_price) AS total_sales
FROM fact_sales f
JOIN dim_products p ON f.product_id = p.product_id
JOIN dim_date d ON f.date_id = d.date_id
GROUP BY p.product_name, p.category, d.date;
Snowflake Schema
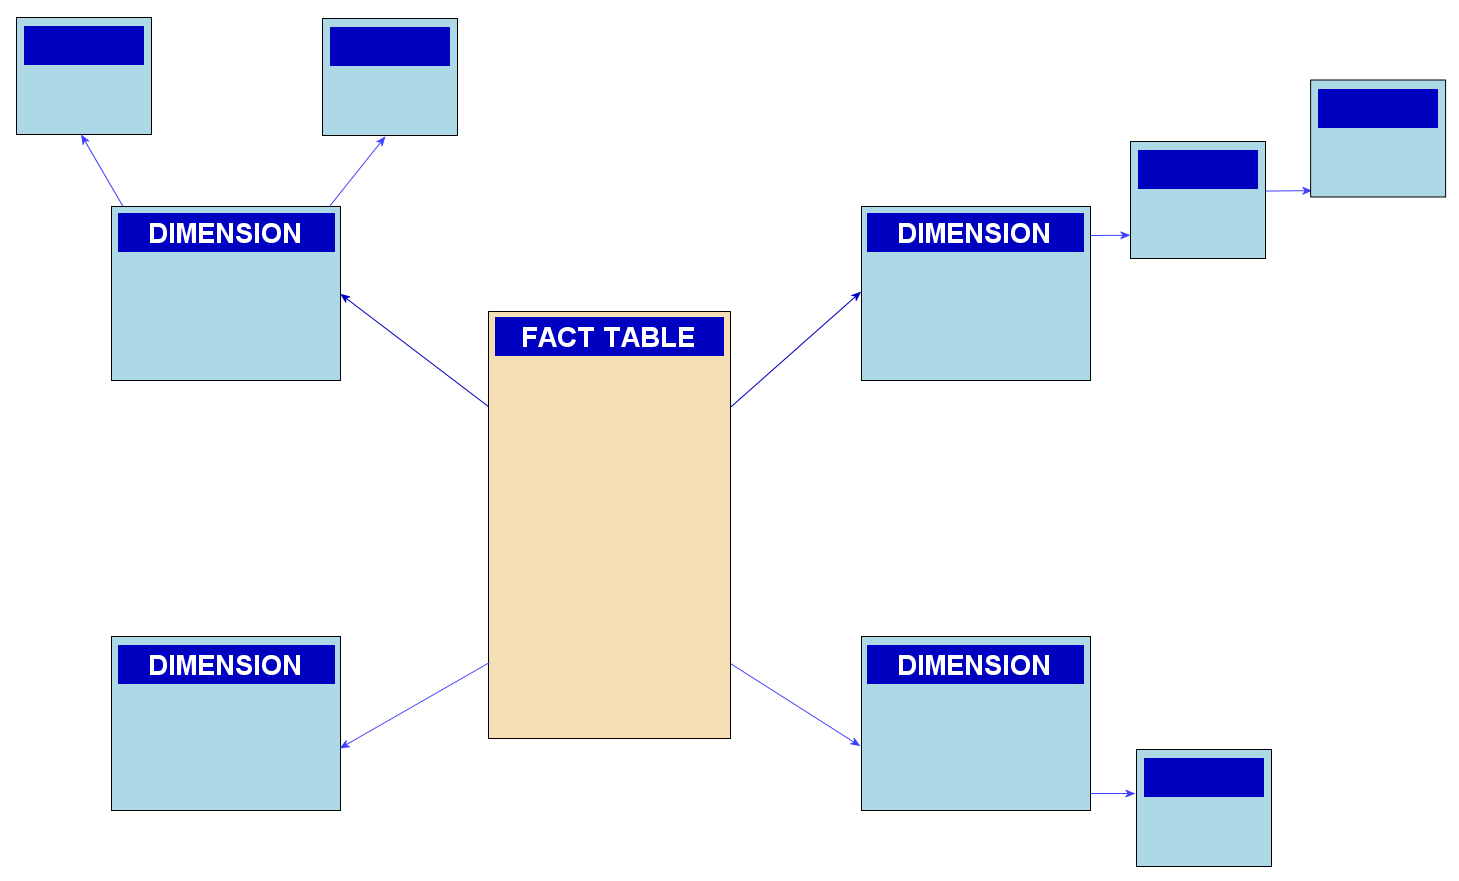
- Just star schema but with sub-dimension tables (normalized dimension tables)
- Dimension tables split into multiple related tables
- Reduces redundancy but increases query complexity
-- Snowflake Schema in Postgres (CREATE)
CREATE TABLE dim_customers (
    customer_id INT PRIMARY KEY,
    first_name VARCHAR(50),
    last_name VARCHAR(50),
    email VARCHAR(100),
    city VARCHAR(50),
    state VARCHAR(50),
    country VARCHAR(50)
);

CREATE TABLE dim_products (
    product_id INT PRIMARY KEY,
    product_name VARCHAR(100),
    category VARCHAR(50),
    price DECIMAL(10, 2)
);

CREATE TABLE dim_date (
    date_id INT PRIMARY KEY,
    date DATE,
    year INT,
    month INT,
    day INT,
    quarter INT,
    week INT,
    day_of_week VARCHAR(10)
);

CREATE TABLE fact_sales (
    sale_id INT PRIMARY KEY,
    customer_id INT REFERENCES dim_customers(customer_id),
    product_id INT REFERENCES dim_products(product_id),
    date_id INT REFERENCES dim_date(date_id),
    quantity INT,
    unit_price DECIMAL(10, 2),
    total_price DECIMAL(10, 2)
);
-- Joining snowflake schema
SELECT
    p.product_name,
    p.category,
    d.date,
    SUM(f.total_price) AS total_sales
FROM fact_sales f
JOIN dim_products p ON f.product_id = p.product_id
JOIN dim_date d ON f.date_id = d.date_id
GROUP BY p.product_name, p.category, d.date;
Best Practices
- Use Star Schema for simplicity and speed
- Use Snowflake Schema when normalization is required
- Maintain clear documentation of joins and keys
Core Concepts of Fact Table Grain
1. Clear Definition of a Fact's Level of Detail
The grain describes the smallest unit of measurement stored in the fact table.
- A row could represent an order, an order line, a page view, or a daily summary
- Every measure and dimension attached to the table must match this level
- A well-defined grain prevents confusion and ensures consistent calculations
Having clarity on "what one row means" is the foundation of all analytical modeling.
2. Alignment with Business Processes
Fact tables must reflect real-world business events.
- Choose grain based on how the business tracks activity (item sold, payment made, shipment sent)
- Ensure modelers and stakeholders agree on the event the fact table represents
- Consistent event-based grain enables trustworthy KPI calculations
3. Avoiding Mixed Granularity
Mixing multiple levels of detail in one fact table introduces major analytical issues.
- Rows with different grains cause double-counting
- Measures become unreliable or impossible to aggregate correctly
- Dimensions may not join consistently
4. Supporting Historical and Time-Based Analysis
Granular fact tables offer more flexibility for time-based insights.
- Detailed grains (e.g., order lines, clicks) support deep behavioral analysis
- Coarser grains (e.g., daily summaries) are faster but less flexible
- Choose the grain that aligns with how KPIs need to be calculated over time
Design and Operational Principles
5. Impact on KPIs and Metrics
Grain directly influences how KPIs are computed.
- Revenue, conversion, churn, and retention metrics depend on accurate grain
- Incorrect grain leads to inflated totals, missing context, or inconsistent KPIs
- Measures must be defined at the same level of detail as the fact table
6. Influence on Aggregation Logic
The grain determines how data rolls up into summaries.
- Granular facts support flexible aggregations (daily, weekly, customer-level, product-level)
- Coarser grains restrict the types of insights possible
- With the wrong grain, aggregations either break or become overly complex
7. Performance and Storage Considerations
Grain affects table size, query performance, and compute cost.
- Finer grains create large, detailed fact tables -- great for analysis, but heavier to process
- Coarser grains are smaller and faster, but lose information
- Choose a grain that balances flexibility with performance
8. Consistent Relationship with Dimensions
Dimensions must match the grain to attach correctly.
- If the grain is at the order-line level, dimensions like product, customer, and date must relate at that level
- Misaligned grains cause broken joins or duplicated rows